Published on: 2025-10-10

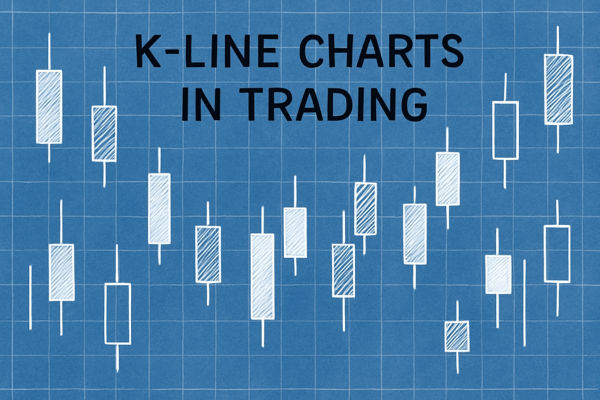
A K-Line, also called a candlestick, is a visual tool that displays four price points for a given time period: open, close, high, and low. The body is the thick rectangle between the open and close prices.
K-Line body size should confirm momentum strength because a long body shows that price moved decisively in one direction with strong buying or selling pressure, while a short body indicates indecision or weak follow-through.
The larger the body, the stronger the momentum and the more conviction behind the move. The wicks, or shadows, are thin lines extending from the body that show the high and low prices reached during that period.
K-Lines pack more information than simple line charts by showing the battle between buyers and sellers within each time period. Body size helps traders judge conviction: a series of long green bodies suggests a strong uptrend, while long red bodies signal a powerful downtrend.
Small bodies near support or resistance can flag indecision before a breakout or reversal, giving traders early warning to adjust positions. K-Lines are universal across stocks, forex, and crypto, making them a core skill for any market.
Long body: shows strong momentum and commitment. In an uptrend, long green bodies confirm buyers are in control. In a downtrend, long red bodies confirm sellers dominate.
Short body: signals weak momentum, indecision, or consolidation. Price moved little between open and close, meaning neither buyers nor sellers gained the upper hand.
Colour: green or white body means the close was higher than the open, showing bullish action. Red or black body means the close was lower than the open, showing bearish action.
Long wicks show rejection: a long upper wick means buyers tried to push higher but sellers pulled price back. A long lower wick shows sellers pushed down but buyers recovered.
Compare body length to the average of the past 10 to 20 K-Lines on the same timeframe.
Use average true range as a baseline: body over 80% of ATR suggests strong momentum, under 30% flags weak momentum.
Relative sizing: if recent bodies average $1.00, a $3.00 body is exceptional and likely signals breakout or exhaustion.
Context matters: first long body after consolidation carries more weight than the tenth in a trend.
A stock opens at $50.00 and closes at $52.00, with a high of $52.20 and a low of $49.80.
The K-Line shows a green body from $50.00 to $52.00, a short upper wick to $52.20, and a lower wick to $49.80.
The $2.00 body size confirms strong bullish momentum because price moved decisively higher and held most of the gain.
If the next K-Line opens at $52.20, drops to $51.50, and closes at $51.60, the small $0.10 red body combined with a long lower wick from $51.50 signals that sellers tried to push lower but buyers defended.
This small body after the strong $2.00 green body warns of potential consolidation or reversal, especially if volume was light.
Body size gains meaning when compared to recent K-Lines and combined with other signals.
A long body after several small bodies can signal a breakout or the start of a new trend.
Shrinking body size after a rally often warns of exhaustion and potential reversal.
Body size relative to the total range matters: a long body with short wicks shows control, while a long body with long wicks suggests a fight.
| Body Size | Volume | Interpretation |
|---|---|---|
| Long body | High volume | Strong conviction, reliable signal, likely continuation |
| Long body | Low volume | Suspect move, possible trap, wait for confirmation |
| Short body | High volume | Accumulation or distribution, watch the next K-Line closely |
| Short body | Low volume | Quiet consolidation, no actionable signal yet |

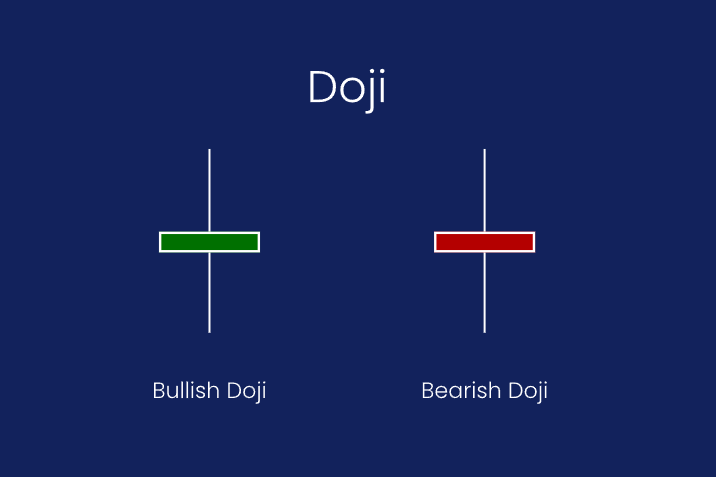
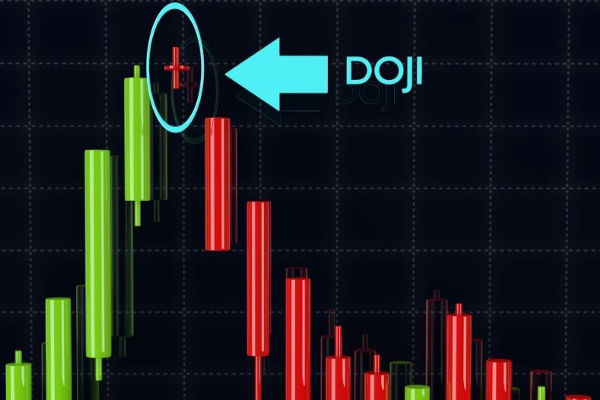
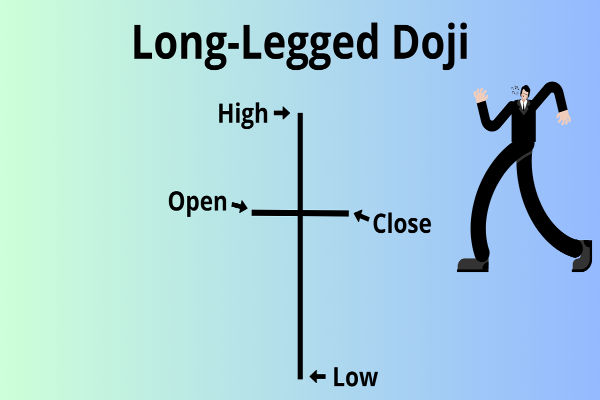
Doji: open equals close, creating a tiny or no body. Signals indecision and often appears before reversals.
Hammer: small body at the top with a long lower wick. Bullish reversal signal if found after a downtrend.
Engulfing: a large body completely covers the previous K-Line's body. Strong reversal signal when it appears at trend extremes.
Spinning top: small body with long wicks on both sides. Shows uncertainty and often precedes a trend change.
Check the daily chart even if trading intraday: a long 5-minute body inside a small daily body may be noise.
Align timeframes: if daily shows long bullish body and 1-hour shows long bullish body, conviction is higher.
Use higher timeframe body size to set context, lower timeframe to time entry.
Conflicting body sizes across timeframes suggest consolidation or indecision; wait for alignment.
| Body Characteristic | Signal | Action |
|---|---|---|
| Long body, short wicks, high volume | Strong momentum, conviction | Follow trend, trail stops |
| Long body, long wicks, mixed volume | Battle, possible exhaustion | Wait for next K-Line confirmation |
| Short body, any wicks | Indecision, consolidation | Avoid new positions, watch for breakout |
| Progressively shrinking bodies | Weakening momentum | Prepare for reversal or breakout |
| Single long body after small bodies | Potential breakout or trap | Confirm with volume and next K-Line |
Professionals layer K-Line analysis with volume, support and resistance, and multi-timeframe alignment.
They watch body size relative to the average true range to normalise for volatility, so a long body in a calm market is judged differently than in a volatile one.
Before entering, they require confirmation: a long body breakout candle followed by another strong body, or a reversal pattern supported by a volume surge.
They use K-Line wicks to set tight stops just beyond rejection zones, reducing risk while staying in the trade if momentum continues.
Candlestick: another name for K-Line, showing open, close, high, and low in a visual format.
Body: the thick rectangle between open and close that measures momentum strength.
Wick or Shadow: thin lines above and below the body showing the high and low prices and price rejection.
Doji: a K-Line with no body or a very small body, signalling indecision and potential reversal.
K-Line body size should confirm momentum strength because it directly measures the distance price travelled between open and close.
Use body size in context with recent K-Lines, wicks, volume, and support or resistance to improve timing and reduce false signals.
Long bodies confirm conviction, short bodies warn of hesitation, and combining both with pattern recognition and multi-timeframe checks sharpens entries and exits.