Published on: 2025-08-29
Updated on: 2025-09-02

Technical analysis is the study of historical price and volume to help anticipate potential moves. It looks for trends, momentum shifts, and key levels such as support and resistance. The focus is on what the market is doing rather than why, and it can be applied across any timeframe or asset class.
Timing determines whether a good idea becomes a good trade. By defining entry points, stop-loss locations, and realistic targets, technical analysis turns vague opinions into detailed plans. This structure helps reduce emotional decisions and supports consistent risk control.
Many traders also use it alongside fundamental analysis. Fundamentals can define the bias, while technicals refine the exact timing and risk parameters.
The following table summarises common indicator categories and how traders typically use them:
| Indicator Type | What It Measures | Typical Use | Common Tools |
|---|---|---|---|
| Trend | Direction and persistence of price moves | Trade with the prevailing direction | Moving Averages, MACD |
| Momentum | Speed or strength behind moves | Spot exhaustion or continuation | RSI, Stochastics |
| Volume | Commitment behind price action | Confirm breakouts or divergences | OBV, Volume Profile |
| Volatility | Range and variability of price | Set stops and adapt position size | ATR, Bollinger Bands |

A short example shows how to translate a chart read into a plan. Imagine a $10,000 account. A stock has trended higher and is pulling back toward the 50-day moving average and a prior support zone.
Planned entry: $49.50 near the 50-day moving average and support
Stop-loss: $48.80 below the recent swing low
Risk per share: $0.70
Maximum account risk: 1% or $100
Position size: $100 ÷ $0.70 ≈ 142 shares (round to 140)
Target: $52.50 at the prior high
Risk to reward: about 1:4.3
If the target is reached, the gain is roughly $420, or about 4.2% of the account, while a stop would cap the loss near $100.
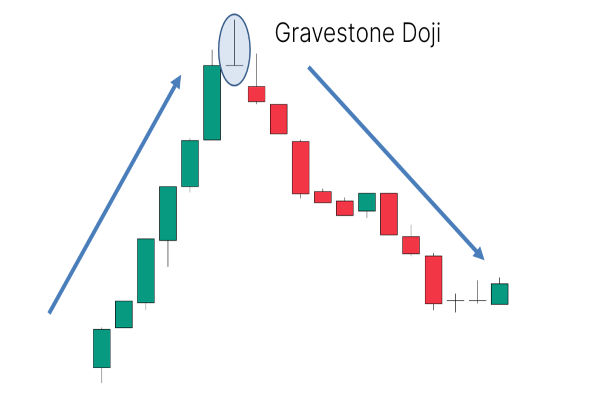
Short trade scenario: A stock rallies into $65 resistance with weakening RSI and falling volume. A trader could sell short at $64.80, place a stop at $65.50 above resistance, and target $62.00. The plan is defined before entry, which keeps risk controlled.
Treating technicals as a prediction instead of a probability
Using too many indicators and creating conflicting signals
Placing stops at obvious round numbers that are easily hunted
Failing to adapt methods to choppy versus trending regimes
Ignoring volume confirmation on breakouts or breakdowns
Overlooking slippage and transaction costs in tight-edge systems
Trend: The general direction of price, often defined by higher highs and higher lows or moving averages
Support and Resistance: Areas where buying or selling pressure has repeatedly emerged
Moving Average: The average price over a period that smooths noise and can act as dynamic support or resistance
RSI: A momentum oscillator that highlights overbought or oversold conditions
Chart Pattern: A recurring price formation, such as a double bottom or head and shoulders

Experienced traders treat technical analysis as a rule-based execution framework. They seek confluence at the entry, use volatility-aware stops, and size positions from the distance to invalidation so dollar risk stays consistent.
Multi-timeframe alignment: Trade in the direction of the higher timeframe and time entries on a lower timeframe
Confluence: Combine levels and signals such as support, moving average, and momentum confirmation
Volatility-based stops: Place stops beyond structure and adapt size as ATR changes
Pattern statistics: Track win rate, average win and loss, and expectancy by setup
Regime adaptation: Tighten risk and targets in ranges, extend targets in strong trends
Level-first approach: Mark key support and resistance, then look for confirmation from momentum and volume
ATR stop logic: Use a stop at 1 to 2 times ATR beyond a level, so normal noise does not knock you out early
Risk budgeting: Risk a fixed 0.5% to 1.5% per trade and avoid stacking multiple correlated positions
Define entries at levels that align with the higher timeframe trend
Place stops where the trade thesis fails rather than at round numbers
Size positions from stop distance so each trade risks the same dollars
Confirm key moves with volume when possible
Record outcomes by setup and refine the playbook over time
Technical analysis is not about predicting every twist in the market, but about structuring trades so that risk is controlled and opportunities are taken with purpose. By combining disciplined chart reading with robust risk management, traders can improve their timing, reduce costly mistakes, and give small, consistent edges the chance to build into meaningful long‑term results.


World's Best Broker