Published on: 2025-08-29
Updated on: 2025-09-02

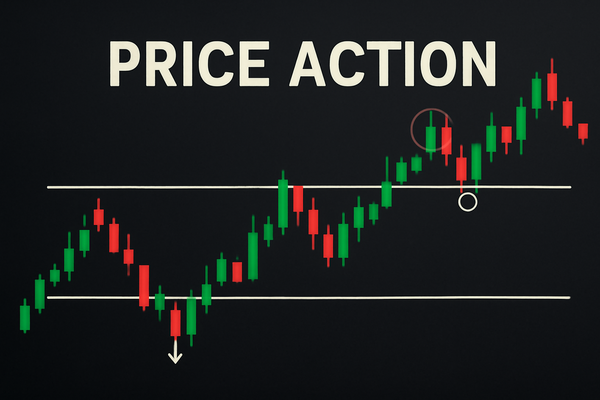
Price action refers to the study and interpretation of an asset's raw price movements—such as candlestick formations, chart patterns, and trends—without relying on traditional technical indicators like moving averages or oscillators. This method is grounded in classical charting techniques and candlestick analysis, focusing on how prices behave moment by moment.
Price action traders read the market's real-time “story” directly from price itself, believing that all necessary information, including market sentiment and supply-demand balance, is embedded in the price. It is an unfiltered and immediate reflection of trader behaviour, without any delay or smoothing that technical indicators often introduce.
Understanding price action is crucial because it reveals the collective psychology of buyers and sellers as it happens. When traders use price action, they don't wait for an indicator to confirm what price is already showing. Instead, they act on visual cues like support and resistance levels, trend formation, and candlestick signals to anticipate future moves.
This immediacy means price action can offer earlier entry or exit points compared to lagging tools. It also helps traders adapt fluidly to varying market environments since patterns evolve naturally with changing supply and demand dynamics.
Many discretionary traders favour price action for its flexibility and transparency, allowing them to interpret charts according to different time frames and market contexts. It removes some of the noise created by indicators, enabling a clearer focus on pure price behaviour.
Let's consider trading shares of GlobalTech, currently priced at $100 per share.
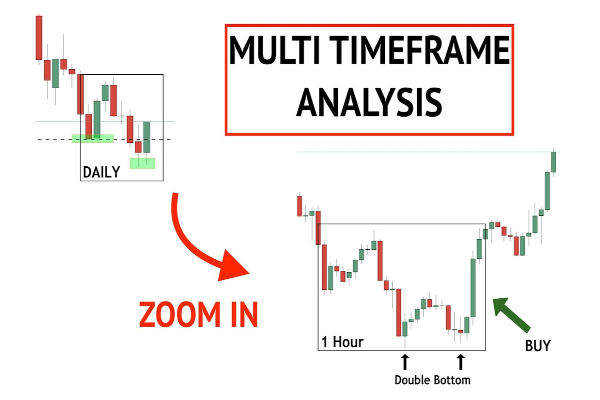
Price Action Approach: You observe a classic double-bottom pattern forming around $98, signalling strong buying support. When the price breaks above $101, it confirms the pattern. Acting on this, you enter a buy at $101, anticipating the stock's rally to $105 or beyond.
Indicator Approach: Meanwhile, an indicator such as a 20-day moving average crossing above the 50-day moving average might signal a buy, but only after the price has already surged to $104. This delayed signal may cause you to enter late, missing some profit potential.
By focusing on price action, you leverage visual chart cues to get ahead of indicator lag and react quicker to shifts in market sentiment.
However, remember that in ranging or choppy markets, indicator crossovers can sometimes filter out false signals better than price action alone, highlighting the importance of context.
Though powerful, price action trading has its challenges:
“Price Action Never Fails”: Like any method, price action signals can misfire in volatile or sideways markets, leading to false breakouts and whipsaws.
Dismissal of Indicators: Some traders mistakenly reject all indicators. Many successful pros blend price action with key tools to cross-check signals and manage risks carefully.
Overcomplicating Patterns: Trying to recognise every possible candlestick or chart formation creates information overload and indecision. Focus on high-probability setups instead.
Ignoring the Bigger Picture: Concentrating solely on short-term price moves may cause you to miss important fundamental drivers or long-term trends.
Subjectivity: Price action analysis can be interpreted differently by traders, so maintaining discipline and consistency is essential.
Cognitive Bias: Traders may see what they want to see—known as confirmation bias—affecting objectivity.
Technical Indicators: Quantitative calculations like RSI, MACD, and moving averages that process price and volume data to generate trading signals. They can complement price action by providing confirmation or warnings.
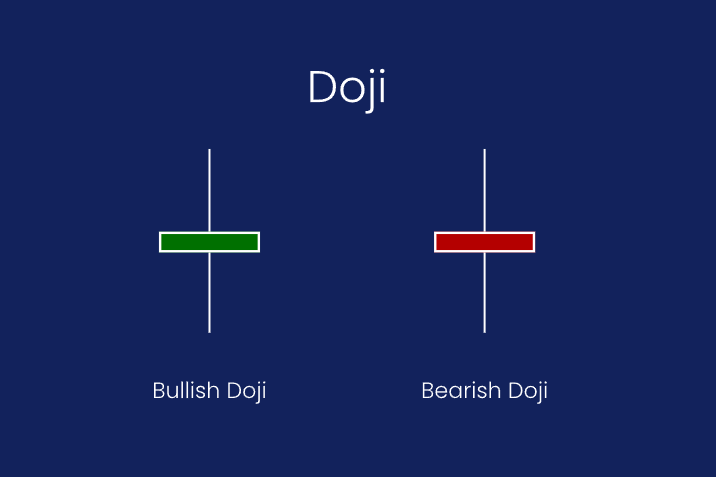
Candlestick Patterns: Visual formations such as hammers and engulfing candles are used by price action traders to judge market sentiment and possible reversals.
Support and Resistance: Crucial price levels where buying or selling pressure causes the price to reverse or consolidate. Central to interpreting price action.
Trend Lines: Straight lines drawn to connect price highs or lows, helping visualise the current market direction.
Order Flow / Market Microstructure: Advanced concepts that analyse the actual buy and sell orders behind price moves, offering even deeper insight than price action alone.

Professional traders know there's no one-size-fits-all approach. Many start by analysing the price action's structure, momentum, and key support/resistance levels, then use carefully selected indicators to add precision and objectivity.
For example:
Using the Relative Strength Index (RSI) to spot potential overbought or oversold conditions while confirming price action breakouts.
Employing moving averages to identify longer-term trends and filter false signals.
Combining price action with volume-based indicators like OBV to confirm the strength behind price moves.
Most importantly, pros manage risk by placing stops and targets aligned with key price action levels, enhancing trade discipline.
If you're new to price action:
Begin with daily and 4-hour charts to understand broader trends and patterns.
Focus on simple, well-known candlestick patterns and chart formations.
Avoid cluttering charts with too many indicators initially.
Practice reading charts consistently to build your intuition.
Use demo accounts to apply price action concepts without risk.
Indicators are most helpful when:
You want a systematic or algorithmic trading approach.
Backtesting strategies with quantitative rules.
Seeking objective confirmation in volatile or illiquid markets.
Combining multiple viewpoints to refine entries and exits.
To deepen your price action knowledge, consider:
Classic books like “Japanese Candlestick Charting Techniques” by Steve Nison.
Reputable charting platforms with customizable candlestick charts.
Online courses focused on technical analysis and price action trading.
Joining trading communities to watch experienced traders apply price action in real time.
By learning to read price directly and integrating it smartly with selective indicators, both beginners and professionals can make faster, clearer trading decisions. Trust your eyes, but keep an open mind to all the tools that enhance your strategy.

World's Best Broker