Published on: 2025-08-29
Updated on: 2025-09-02
")
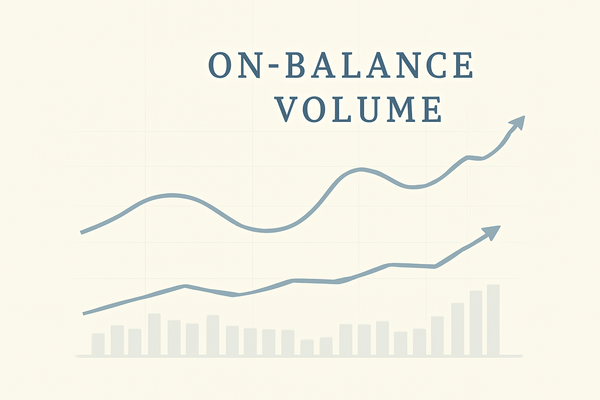
On-Balance Volume (OBV) is a technical indicator that tracks buying and selling pressure by adding volume on days when the price closes higher and subtracting volume on days when it closes lower. Created by Joe Granville in the 1960s, OBV measures the flow of volume to indicate whether money is entering or leaving a security. A rising OBV shows increasing buying pressure, while a falling OBV suggests selling pressure.
OBV is calculated cumulatively each day using this simple rule:
If today's closing price is higher than yesterday's, add today's volume to the OBV.
If today's closing price is lower than yesterday's, subtract today's volume from the OBV.
If today's closing price is the same as yesterday's, OBV remains unchanged.
This running total helps reveal changes in volume flow that may precede price moves.
OBV is a key tool for traders because it highlights the activity of “smart money” — institutional or large investors who often drive future price trends. By showing volume trends behind price movements, OBV can identify accumulation (buying) or distribution (selling) phases before they become evident in price charts. This ability to flag hidden buying or selling pressure makes OBV a valuable confirmation tool in technical analysis.
Suppose you're following Acme Corp's stock:
| Day | Closing Price | Volume (Shares) | OBV Calculation | OBV Value |
|---|---|---|---|---|
| Monday | $20 | 10,000 | Starting point | 0 |
| Tuesday | $21 | 12,000 | $21 > $20, add 12,000 | 12,000 |
| Wednesday | $20.50 | 8,000 | $20.50 | 4,000 |
| Thursday | $21.50 | 15,000 | $21.50 > $20.50, add 15,000 | 19,000 |
If OBV steadily climbs even when the price is flat or slightly up, it indicates investors are accumulating shares. This could signal a stronger future price increase.
On price charts, OBV is typically plotted on the same timeline beneath the price line. Traders look for divergences — situations where the OBV trend moves differently from price. For example:
If prices fall but OBV rises, it may be a sign of hidden buying pressure.
If prices rise but OBV falls, underlying selling might weaken the rally.
Visualising these patterns helps traders anticipate possible trend reversals or confirm breakouts.
OBV New Highs: If OBV hits a new high while price stalls, it often suggests upcoming bullish momentum.
OBV Fails a Price Rise: If OBV doesn't confirm a new price high, treat the move with caution.
Volume Confirmation: Look for consistency—strong volume backing price moves strengthens the signal.
Combine Tools: Use OBV with moving averages, RSI, or other indicators for a fuller picture.
OBV Doesn't Predict Alone: OBV should be combined with price action and other indicators, not relied on solely.
Divergence Guarantees No Reversal: Divergences suggest potential moves but don't guarantee them.
Ignoring Volume Anomalies: Sudden spikes due to news or low liquidity can mislead OBV readings.
Not Suitable for Illiquid Markets: Thinly traded stocks or assets may show noisy, unreliable OBV signals.

OBV assumes volume flows correlate with price trends, but:
Algorithmic trading and market noise can distort volume patterns.
News events or sudden announcements might cause volume surges unrelated to typical buying/selling pressure.
Use OBV primarily with liquid assets to avoid misleading volume effects.
Always confirm OBV signals with price patterns and other analytics.
Stocks: OBV is widely used due to reliable volume data.
ETFs & Commodities: OBV is effective where volume is transparent.
Cryptocurrency: Volume data quality varies; exercise caution.
Forex: OBV is less effective as volume data is often unavailable or misleading.
Accumulation/Distribution (A/D) Line: Similar to OBV but also considers where the price closes within its daily range, offering a nuanced view of buying/selling pressure.
Volume: The count of traded shares or contracts; the core data behind OBV.
Divergence: A mismatch between OBV and price trends that may signal trend changes.
Moving Average: A tool to smooth OBV data and identify longer-term volume trends.
| OBV Signal | What to Look For | Possible Interpretation |
|---|---|---|
| OBV rising with price rising | Strong buying pressure | Confirmed uptrend |
| OBV rising with flat price | Hidden accumulation | Potential upcoming breakout |
| OBV falling with price rising | Weakening buying pressure | Possible false rally or reversal |
| OBV falling with price falling | Strong selling pressure | Confirmed downtrend |
| OBV divergence | Price and OBV move oppositely | Possible trend reversal or correction |
Experienced traders monitor OBV “breakouts”—when OBV surges beyond prior highs/lows—anticipating strong price moves before they appear in price charts. Combining OBV with other volume-based indicators like the A/D line and setting alerts for divergences in highly liquid US stocks and ETFs allows for timely trade entries and exits. Tracking OBV alongside macro volume trends helps pros confirm whether market moves have strong backing or risk being short-lived false signals.
By adding volume context to price analysis, OBV grants traders insights into investor activity hidden beneath surface price moves, helping you make better-informed decisions from beginner through to professional levels.