Published on: 2023-06-05
Updated on: 2024-05-23
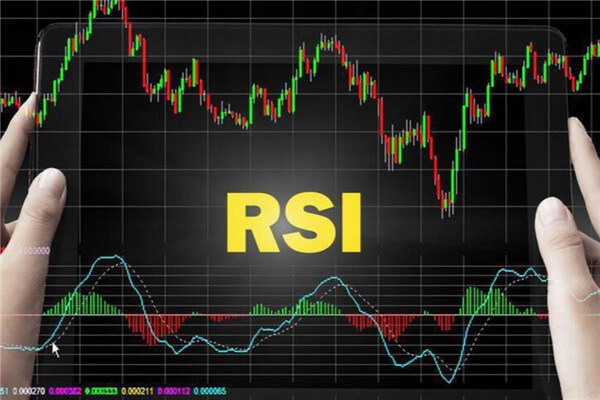
RSI is the Relative strength index. It is a technical curve made according to the ratio of the sum of the rising and falling ranges in a certain period of time. It is used to measure the supply and demand relationship and buying and selling strength of the market, and can reflect the prosperity of the market in a certain period of time.
The buying and selling behavior of investors is a reflection of the comprehensive results of various factors, and the changes in the market ultimately depend on the supply and demand relationship. RSI indicators, based on the principle of supply and demand balance, evaluate the strength of long short forces by measuring the percentage of the total increase in Stock Prices within a certain period to the average of the total change in stock prices, and then prompt specific operations.
The Relative Strength Index (RSI) is a method and indicator used to measure market supply and demand relationships and buying and selling power. Shareholders can use RSI relative strength indicators to break through signals for precise trading of stocks.
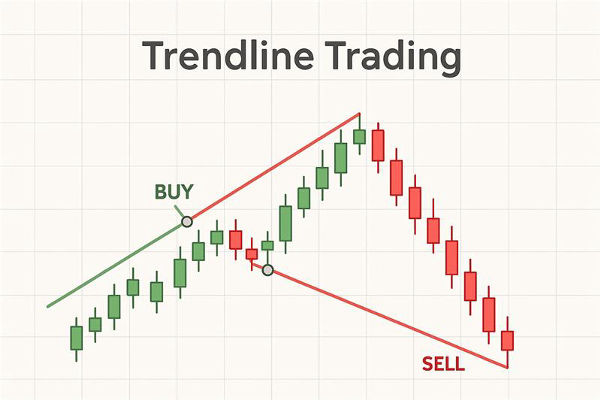
1. Upward breakthrough
During a relatively recent period of stock price operation, two or more high points of the RSI index (with RSI values close) form a pressure line. When the stock price rises and touches the pressure line, it usually encounters strong pressure and falls downward. On a certain day, once the rsi indicator successfully breaks through the pressure line, the opportunity for future upward growth increases. If the trading volume continues to increase and the Moving Average supports the long signal, then you can boldly buy and successfully make a short to medium term market.

In the above figure, during the bottom fluctuation of the stock price, the RSI index forms four relative high points, and their indicator values all show a downward trend near point 59. Connecting these four high points into a straight line constitutes a pressure band. Every time the RSI index touches this pressure line, there will be a short-term downward trend. At the end of the adjustment period, the banker made a bearish trap at the bottom, forming the last drop. After short-term adjustments, the RSI index successfully broke through the pressure line, and the market experienced a long flip, opening up room for upward movement. The day closed at 6.58 yuan.
At this point, the stock price successfully stood above the moving average system, and the 5-day moving average of the Golden Cross continued to rise after the 10-day moving average of the Golden Cross, followed by the 30-day moving average of the Golden Cross. The 30-day moving average showed an upward trend, and the moving average system diverged towards the bulls, forming a good buying opportunity.
In this round of the market, the stock price reached a maximum of 13.28 yuan and doubled.
2. Breakthrough Down
During a relatively recent period of stock price operation, two or more low points (similar RSI values) of the RSI index form a support line. When the stock price falls back near this support line, it usually stabilizes and rebounds after reaching support. On a certain day, once the RSI indicator effectively falls below this support line, the opportunity for future decline increases. If the moving average tends towards a short signal, it is a sell signal.

In the above figure, after a significant decline, the stock price stabilizes and rebounds upwards, forming an upward trend. At this time, the RSI index generates multiple low points, and the indicator values between the low points are very close. Connecting these low points into a straight line forms a clear support line. Every time the stock price reaches a low point and approaches it, there is a certain degree of upward trend.
Finally, this support line was finally broken down by a strong bear side, and the stock price peaked and fell. The 5-day moving average was dead crossed by the 10 day moving average and continued to decline. The 30 day moving average was then dead crossed by the 10 day moving average, and the 30 day moving average went down. The average line system formed a short position arrangement, forming a sell signal. Afterwards, the market turned into a decline, forming a downward channel.
【 EBC Platform Risk Reminder and Disclaimer 】: There are risks in the market, and investment needs to be cautious. This article does not constitute investment advice.


World's Best Broker