Published on: 2023-06-05
Updated on: 2024-08-28
Forex technical analysis mainly refers to making certain judgments on the future direction and degree of changes in a certain forex market or a specific currency price based on historical market data. In practical applications, charts with various technical indicators are usually used and combined with certain rules to predict the trend of exchange rates, so they are often vividly referred to as chart analysis methods.

The chart analysis method uses charts that record prices to study the market and determine the future direction of prices. So for investors who are not familiar with the technical analysis of forex, the first thing is to understand what types of charts are commonly used.
1、 Types of Forex Technical Indicator Charts
1. Bar chart
A bar chart, also known as a bar chart, bar chart, bar chart, bar chart, or bar chart, is a statistical chart that uses the length of a rectangle as a variable. A bar chart is used to compare two or more values (at different times or under different conditions), with only one variable, and is usually used for analysis on smaller datasets. A bar chart can also be arranged horizontally or expressed in a multidimensional manner.
It is the most basic chart that reflects price behavior. Each column represents a period of time - at least 1 minute and at most several years. Over time, the bar chart reflects different price patterns.
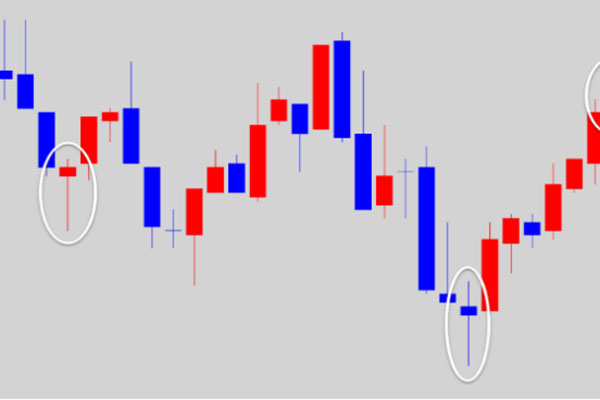
2. Candle chart (K-line chart)
Candle chart generally refers to the K-line chart. The drawing of the K-line chart in the stock and futures markets includes four data, namely opening price, highest price, lowest price, and closing price. All K-lines are unfolded around these four data, reflecting the overall situation and price information. If you put the daily K-line chart on a piece of paper, you can get a daily K-line chart, and you can also draw weekly and monthly K-line charts.
Unlike a simple bar chart, each candlestick represents the highest, lowest, opening, and closing prices for a period of time. Provide investors with stronger visual information.
3. Dot line diagram
A dot and line chart is similar to a bar chart, except that multiple X and O are used to indicate changes in price trends. The dot and line chart is independent of time and only emphasizes price changes.
2、 Characteristics of Forex Technical Analysis
1. Essentially, it is a record of price fluctuations
Whether it is the K-line or the Moving Average, indicators are derived statistics of prices, so the core is still price fluctuations.
2. It is impossible to guarantee the absolute accuracy of the analysis results
Technical analysis often uses statistical analysis as a means, and the analysis result is actually a probability event, not an absolute event. That is to say, market analysis results are only a type of prediction, which may or may not be correct. These prediction results can only be used as the basis for formulating investment plans, but preparations must be made in the plan to deal with the errors in the prediction results. And stop loss is a necessary measure to prevent errors in the analysis results.
3. Not applicable to all markets
Each technical analysis method has its advantages and disadvantages, and each is suitable for a certain market environment.
Forex technology analysis is more commonly used by experienced traders, and investors who have just started can combine their own needs and learn some simple theories and methods to start the path of forex technology analysis.
【 EBC Platform Risk Reminder and Disclaimer 】: There are risks in the market, and investment needs to be cautious. This article does not constitute investment advice.
World's Best Broker
EBC Financial Group is a co-brand shared by a group of entities
including:
EBC Financial Group (SVG) LLC is authorized by the St.Vincent and the
Grenadines Financial Services Authority(SVGFSA),and the company
registration number is 353 LLC 2020, with registered address at Euro
House, Richmond Hill Road, Kingstown, VC0100, St. Vincent and the
Grenadines.
Other Relevant Entities
EBC Financial Group (UK) Limited is authorised and regulated by the
Financial Conduct Authority. Reference Number: 927552. Website: www.ebcfin.co.uk
EBC Financial Group (Cayman) Limited is licensed and regulated by the
Cayman Islands Monetary Authority (Number: 2038223). Website:
www.ebcgroup.ky
EBC Financial (MU) Limited is licensed and regulated by the the
Financial Services Commission, Mauritius (License Number GB24203273)
with registrated address at 3rd Floor, Standard Chartered Tower,
Cybercity, Ebene, 72201, Republic of Mauritius. Website for this entity
is maintained separately.
EBC Financial Group (Comoros) Limited is authorised by The Autonomous
Island of Anjouan, Union of Comoros Offshore Finance Authority with
License number L 15637/EFGC, with registered office address at Hamchako,
Mutsamudu, Autonomous Island of Anjouan, Union of Comoros.
EBC Financial Group (Australia) Pty Ltd (ACN: 619 073 237) is authorised
and regulated by the Australian Securities and Investments Commission
(Number: 500991). EBC Financial Group (Australia) Pty Ltd is a related
entity of EBC Financial Group (SVG) LLC. The two entities are managed
separately. The financial products and services offered on this website
are NOT provided by the Australian entity and no recourse against the
Australian entity is available.
EBC Group (Cyprus) Ltd, faciliates payment services to the licensed and
regulated entities within the EBC Financial Group strucutre, registered
under the Companies Law of Republic of Cyprus with the number HE 449205,
registered office address at 101 Gladstonos, Agathangelou Business
Centre, 3032 Limassol, Cyprus.
Business Address: The Leadenhall Building, 122 Leadenhall Street, London, United Kingdom, EC3V 4AB. Email Address :cs@ebc.com . Telephone : +44 20 3376 9662
Regional Restrictions:
EBC does not offer any services to citizens and residents of certain
jurisdictions including: Afghanistan, Belarus, Burma (Myanmar), Canada,
Central African Republic, Congo, Cuba, Democratic Republic of the Congo,
Eritrea, Haiti, Iran, Iraq, Lebanon, Libya, Malaysia, Mali, North Korea
(Democratic People's Republic of Korea), Russia, Somalia, Sudan, South
Sudan, Syria, Ukraine (including Crimea, Donetsk, and Luhansk Regions),
the United States, Venezuela, and Yemen.
Any Spanish on this website is for LATAM only and is not designated for
anyone in European Union or Spain For more information, please check out
our FAQs.
Any Portuguese on this website is for Africa only, and is not designated
for anyone in European Union or Portugal or Brazil. For more
information, please check out our FAQs.
Compliance Disclosure:The website can be accessed globally and is not specific to any entity. Your actual rights and obligations will be determined based on the entity and jurisdiction that you choose to be regulated.There may be local laws and regulations which prohibit or limit your rights to access, download, distribute, disseminate, share or otherwise use any or all of the documents and information published on this website.
Risk Warning: Trading Contracts for Difference (CFDs) are complex financial instruments and come with a high risk of losing money rapidly due to leverage. Trade on margin carries a high level of risk and may not be suitable for all investors. Before deciding to trade Forex and CFDs, you should carefully consider your trading objectives, level of experience and risk appetite. The possibility exists that you could sustain a loss of some or all of your initial trading capital. We recommend that you seek independent advice and ensure you fully understand the risks involved before making any investment decision. Please read the relevant risk disclosure statements carefully before trading.