Published on: 2023-09-20
Updated on: 2024-05-07
Today we will explore some trading tools related to Fibonacci: Fibonacci coils, timelines, and extension lines.

Before introducing these three new tools, first think about why you need to use them. In transactions, not all prices or time points are suitable for entry. We need to use some tools to help investors determine when it is a high-probability entry time, whether from a temporal or spatial perspective. By using Fibonacci tools and other tools, you can find some good entry points or observe important time and space positions to find trading opportunities.
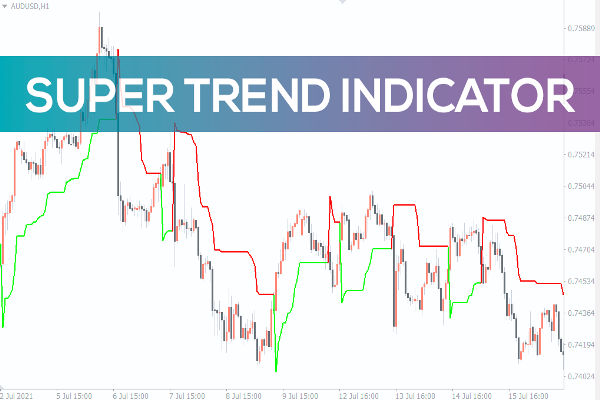
First, let's take a look at the Fibonacci coil. Drawing this coil is very simple; just pull it from the high point to the low point, and the coil is complete. Usually, four values are used: 1.618, 2.618, 3.618, and 4.618. There are many smaller coil levels, but they are usually not used, so they can be turned off. The default setting has a background, but this will make the chart unclear enough, so the background will be turned off and simple colors such as green, yellow, red, and pink will be used, corresponding to different levels. For example, green represents weak callbacks or time points, yellow represents common time points, and red represents the final time point.
After completing the coil, these positions may not be clearly visible on the daily chart, so switch to the four-hour chart for observation.
On the four-hour chart, you can see the coils drawn from high to low points. Observing this coil, it is often observed that there may be some reversal phenomena when the price approaches the vicinity of the coil. This means that if the market is falling, there may be a rebound when the price approaches the coil. The coil informs when and where to pay attention, solving the problem of time and space.
However, a coil is not a tool to ensure that prices will inevitably reverse. It can only represent the possibility of a reversal when the price or time approaches the coil, but the magnitude of the reversal is uncertain. Therefore, it is necessary to pay attention to these temporal and spatial locations in order to identify potential trading opportunities.
Next, we will introduce the Fibonacci timeline. Drawing a timeline is also very simple. Select a high point, a low point, and then a high point, usually using only three values: 0.382, 0.618, and 1. Similarly, use green, yellow, and red to represent the intensity of each region, with red representing the final bottom line.
The timeline represents which time points to pay attention to after the price drops and the callback is completed. For example, when prices approach the green position, there may be a slight rebound. Then, continue to decline until there is another rebound near the yellow line. Finally, it continued to fall to the red line and rebounded again. Through the timeline, it can be seen that there may be price changes in the market near these time nodes, which can help investors make operational decisions.
Extension lines are also a useful tool that requires three points to draw. The expansion line represents where to focus if prices fall again after rising, and which positions may provide support or opportunities to continue the long trend. By drawing an extension line, one can understand where the price may stop falling if it falls from this position and where profit targets should be set if it rises again. This tool can help investors determine the maximum profit point and support/resistance position of prices.
By combining these three tools, we can analyze the market more comprehensively. For example, for the S&P 500, the golden section can be used to identify potential support and resistance positions. The Fibonacci coil can determine key points in time. The Fibonacci timeline can provide more time information. Finally, the expansion line can identify potential support and resistance positions, as well as profit targets.
Disclaimer: This material is for general information purposes only and is not intended as (and should not be considered to be) financial, investment or other advice on which reliance should be placed. No opinion given in the material constitutes a recommendation by EBC or the author that any particular investment, security, transaction or investment strategy is suitable for any specific person.

World's Best Broker